Win your Budget battles at the frontier

Every year the same ritual plays out in so many companies: Marketing submits its budget requests for the coming fiscal; Finance pokes holes in it; the CEO trusts Finance on these matters more than Marketing and assigns a budget and targets that Marketing must meet. Marketing feels hard pressed to meet those numbers; not enough budget and too much of a stretch target.

This negotiation could benefit from a little more science.  Predictive models of the kind that power more advanced versions of MMM are now capable of forecast accuracy that makes it possible to better understand the impact on the business of marketing activity (paid, owned, earned media and other drivers) and look out into the future covered by the marketing budget.  We can ask what sales (or other measures of success related to brand and business growth) we could expect at different budget levels.

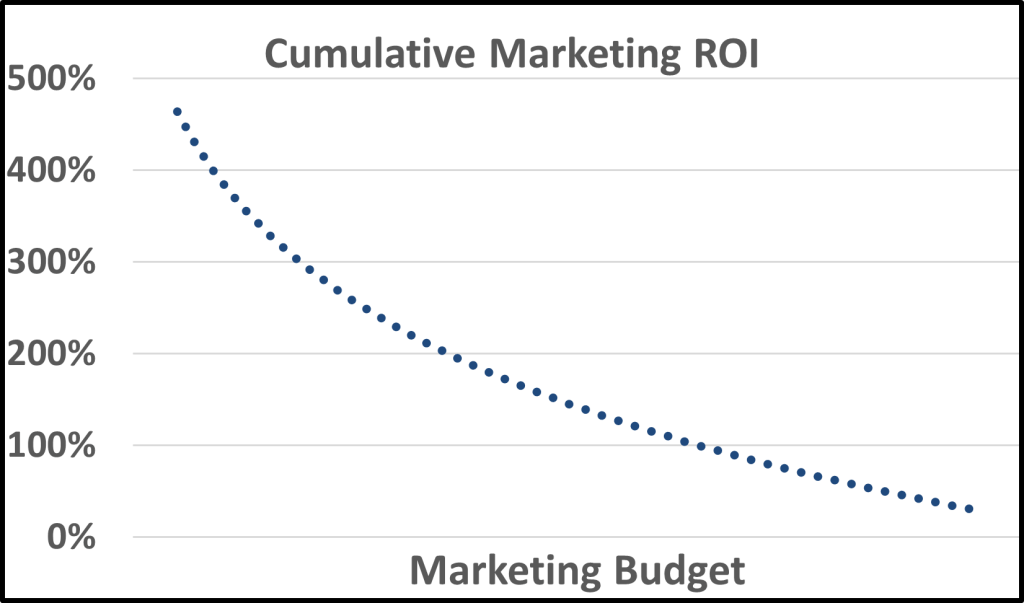
Let’s look at an example of such a model being used to set a marketing budget.  We will start with the efficiency frontier:

We have built a model capable of predicting sales for the coming fiscal year.  We use that model to simulate what sales would be at different budget levels.  What we see is that sales rises as budget increases, but at a decreasing pace.  For each budget increase, sales rises by a lower percentage, giving us this flattening effect.

Now, let’s calculate the Marketing ROI for each budget scenario.  It would look like this:

The first thing to notice is that as we increase budget, Marketing ROI falls.  This is why we dont actually want to “maximize marketing ROI” as you may have heard some say.  The highest ROI in any reasonably managed system of marketing activity occurs at the lowest budget levels.  “Maximizing marketing ROI” is a good way to shrink a business.

Marketing ROI is not a goal; it is a constraint.  We want the benefits of marketing actions to exceed their costs; to make a positive contribution to business profits.  As we add budget, we would inevitably spend it on less and less productive actions, which gives us a diminishing return curve.

So how do we use this approach to set marketing budgets?  Let’s now consider marginal marketing ROI.…the ROI of the increase in spend from one scenario to the next highest spend, in relationship to the sales over that span.  That curve for this data looks like:

Notice that at one point, adding budget returns a negative ROI.

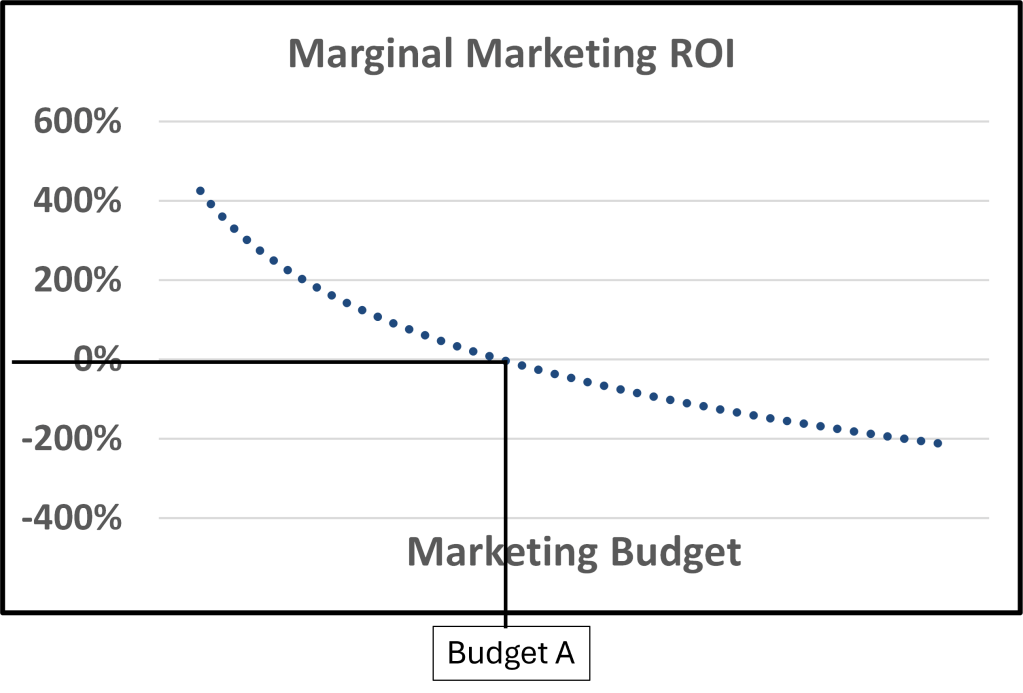
At Budget A, marketing ROI is at break even for the spend between that scenario and the next lowest.  If we increased budget further, we would lose money on those additional activities…something we want to avoid.

At Budget A, marketing’s contribution is at its maximum for this forecast period, and for the market dynamics currently in play, according to the model. 

Let’s put all three graphs together to see the dynamic more clearly:

Key points:

  • Higher marketing ROI’s are found at lower sales levels than Budget A.  Chasing higher marketing ROIs results in lower sales; not good for the brand or the business.
  • Increasing budget above Budget A results in losses on those additional budgets, even though overall, marketing ROI is still positive (until some point where the losses on these additional sales offsets all the gains on sales up to that point.  At an extreme, additional budget may result in no sales increase at all.). A brand could still decide they want to spend above Budget A, to buy share, for example.  With this type of analysis they would know how much that increased sales number is really costing them.

Based on our experience, most marketers spend well below the level of Budget A….missing a lot of opportunity to grow the brand and the business.

Taking this approach requires that the modelling be of sufficient accuracy and reliability.

That is, the model is…..

  • Built around C suite goals, not marketing vanity metrics…
  • …taking a holistic approach to the data used, covering all of the major drivers of business outcomes…
  • …at a level of accuracy that reduces the chances of bad decision making (see Will that model get you promoted? Or fired? (Part 1))…
  • ….has been tested and validated to the satisfaction of the C suite.

Budget battles could be a lot less rancorous and lead to a much larger contribution to brand and business goals if both Marketing and Finance could agree on how the frontier is to be measured and how to use this knowledge to maximize marketing’s contribution to growth.

CMOs: The marketing metric you MUST socialize to the C Suite (hint; it’s not NPS)

It’s incremental lift: the sales your company generates every year due to all forms of marketing communications.

Or put another way, the sales your company would lose if you stopped marcom.   

Based on Navigation’s experience in measuring this, for some companies, that number could be over 50% of sales.

Think about the importance to your company of marketing in that context. 

But to be credible, your source must be a model that meets or exceeds best practices; it must be:

  • Developed around measures the C suite finds meaningful such as sales, and NOT around vanity metrics that have no clear relationship to business success.  The C suite must see clearly how this model supports their goals.
  • Includes data on all, or at least the most important, factors that shape business outcomes.  Certainly paid media, but owned and earned as well.  And factors that may shape outcomes even if not under a CMO’s control such as weather or economic changes.
  • Is accurate; a proven ability to explain over 90% of variation in outcome measures over the most recent 3 year period.
  • Is actionable; you can then demonstrate what to do to improve outcomes, or what would happen if a bad decision were taken
  • Tested in market and shown to produce recommendations that lead to demonstrably better results.

Imagine your relationship with the C suite with this knowledge in place:

  • Imagine a C suite that respects the practice of marketing instead of disparaging it or treating it as an expense taken reluctantly.
  • Imagine a C suite that is looking to help expand the impact of marketing, instead of reflexively cutting marketing budgets in hard times.
  • Imagine the effect such knowledge has on your own team, and the pride taken by knowing how important their work is to the health of their company.
  • Imagine the confidence that comes with making a clear contribution and being appreciated for it.
  • Imagine how much easier budget approvals would be with the full team aligned behind this metric. 
  • Imagine being a valued C suite team member and a driver of growth. 
  • Imagine measuring incremental sales properly, socializing that finding to the C suite, and then updating it regularly.

Is that model going to get you promoted?  Or fired? (Part 2)

The marketing director approached me after I had presented our work in multi-channel ad effect measurement at a large telco.  I had not met him before and he worked for another business unit to the one that had hired us.

He was almost embarrassed to ask the questions that were clearly bothering him.  We sat down over coffee and he told me his story.

He was responsible for direct and digital marketing to the telco’s existing customers, selling a service to add to the one(s) they already had.  His channels were email and addressed direct mail.  Since his budget was limited, he asked the in-house modelling group to help him target his campaign, asking who should get both an email and a DM?  What he showed me was a report of new service activation rates by model decile, after the last campaign had finished.

Before we consider what he and I were looking at, let’s start with what a good targeting model should deliver in a case like this.  Such a model should use data about customers: description and their history of purchases, cancellations, billing and customer service interactions.  It should use the communication history for each individual customer; what channel was used to contact him/her, when, for what product, what offer and what messaging and any interactions that had resulted from campaigns used in the past.  In the case shown below, this particular model also uses neighbourhood demographics.

Consider the following post-campaign report, from a telco client of ours, also for a customer cross-sell campaign.  Predicted scores are the probability of activation (the customer orders and installs the product) for the campaign period (here, 4 weeks after first contact).  These scores were generated about 12 weeks before the campaign was launched; enough time to prepare the mailers.  Actual scores are recorded for the 4 week campaign window, against both non-communicated and non-targeted control groups (our take on control group design for CRM will be covered in a future blog post). 

There are three features of this report we should pay attention to: (deciles represent scores for each customer, averaged)

  1. Each decile shows predicted scores that are lower than the decile before; think of this as a “ski slope” shape. 
  2. There is excellent differentiation between predicted scores for the best decile vs the average (here, 3.1 times) or vs the lowest decile (here, 15.3 times).  The more differentiation, the more opportunity we have to create business value.
  3. There is a close correspondence between predicted and actual by decile. The model does not over- or under-predict for any given decile.  This level of accuracy allows us to invest with confidence.

To the predictions we can now add the cost of contact (here, DM + EM = $3.00) and value of activation (here, $75.00), which gives this picture, for a base of 5 million customers (outcomes assume we contact all customers in each decile):

For planning purposes, we would select only the top 7 deciles in order to maximize profit. 

(For a future blog post: how we can use this as a starting point to create even more value)

Now, let’s consider the picture our director of marketing was looking at.  I mocked up the report, here, from memory. 

As you can see, the best decile for activation rate is NOT the first…it is the fourth.  The first, which should be the best, is the 6th worst.  The 7th has good performance…who would have thought?  In short, instead of seeing the “ski slope” shape we see with a good model, this report looks like a hockey player’s teeth after the playoffs

You cannot make good targeting decisions using this model. Why was it performing this way?

I went next to see a senior member of the modelling team and we quickly agreed on the cause: the model had no communication variables at all.  Instead of being able to ask the question, “what would be the predicted activation rate if I contacted a given customer, with a given channel”?, the model the marketing director was given provided scores that had no relationship to the outcomes he wanted.

Why was it designed this way?  Because the modelling group felt that their scores reflected a prioritization of customers for whom a sale of this type would be most likely to improve retention and generate long term cash flows.  While this is useful as a way to study customer behaviour, it is useless when it comes to designing a marcom campaign, which was their brief. The modelling group felt that the director of marketing had to “learn” how to sell to the top deciles. How?  That question went unanswered.

I often say in the analytics business there is a substantial knowledge gap between the people building models and the decision-makers using them. This gap should be closed with clear, transparent communication. In this case, that didn’t happen; the modelling group pushed a solution that fit their preferences, even knowing it was not what was asked for. 

In cases like these, such models are more likely to get their marcom users fired than promoted.  And that is a failure for all involved.

DB

Will that model get you promoted? Or fired? (Part 1)

Robert Jones, like many of us, trusted his car’s sat-nav system to help guide him to his destination.  But on one unfortunate day, it almost cost him his life. 

On that day, Mr Jones followed sat-nav instructions so closely he dismissed the evidence of his own eyes.  The narrow, steep path he was driving on was clearly unsuitable for a car, but the system told him it was a road.  He almost plunged his car off a 100 ft cliff as a result[1].

That same year, the US National Highway Safety Administration estimated that GPS systems caused over 200,000 accidents every year in the United States[2]

Can we really trust the data and models that we use to navigate our lives?  How do we know when we can, and cannot?

Marketers live in a complex world, and seek to create change in that world.  In doing so, they grapple with problems of targeting, segmentation, evaluation, optimization and diagnostics. Increasingly, they turn to sophisticated analytical technology to disentangle data in search of reliable cause and effect quantification.

Are those models leading marketers to good outcomes, reliably, consistently, or leading them off the proverbial cliff?

There is an imbalance of knowledge between those building advanced analytics systems and their marketing decision-maker users.  The former understands the math and the data, but may not fully grasp the risks.  The latter assumes the risks of using models without, in many cases, having the quantitative skills to assess those risks themselves.  Some don’t even know they are taking on risk, or how much. How can marketers and advertisers protect themselves from the downsides some forms of advanced analytics expose them to?

One should not need to be a Ph.D. in math or stats to use an MMM or CRM model as a client.  But one should be able to do a basic check of the work, enough to spot weaknesses and avoidable risks.

There are three I recommend to my clients:

  • Data: what data is used to build the model
  • Accuracy: how accurate is the model
  • Actionability: how easily and effectively can the model’s prescriptive analytics be implemented?

Let’s do a high level review of each, in the context of a Marketing Mix Model use case. 

Data: what data is used to build the model

Before building an MMM, you should satisfy yourself that the right data goes into its construction, not just the easy data, that is, data easily available.  Ask yourself what factors causes changes in the outcomes you are interested in.  For an MMM, these would certainly include paid media, but you should also include owned and earned media as well.  And you should include data on factors that may be out of a marketer’s control but that affect outcomes strongly such as weather or local economic conditions.  Take a holistic approach to understanding what drives outcomes. Not all factors tested in the model may be significant, but taken together they are more likely to produce a model you can trust than if major drivers are ignored.

Today, many advertisers rely on digital attribution systems that break this rule by focusing on digital media data only.  Those results should be treated with great caution.

Accuracy: how accurate is the model

If a model can reproduce the time series outcome data on your business with a high degree of accuracy, we believe it is fairly quantifying those cause-and-effect relationships that shape those outcomes.  But how accurate does it need to be?

Consider this case.  This brand does $1.2 billion in sales per year; you see three years here in time series.  As you can see, the predicted sales numbers, from our model, almost matches the actual.  We explain 95% of the variation in sales we see over this time….not just the broad trend of the business but the monthly nuance.  

In our work, we advocate accuracy rates at or over 90% over the calibration period, validated by an out-of-period test of fit. 

The higher the accuracy, the lower the risk of mis-attribution and of making bad forward-planning decisions.  Cause-and-effect are properly quantified and effects dis-entangled.  Marketing and advertising decisions can be made with greater confidence and good outcomes follow.

Actionability: how easily and effectively can the model’s prescriptive analytics be implemented?

Consider how easy, or how difficult, it is to make changes to your marcom decisions using the model.  The more directly the model reflects how media is actually planned and bought, the easier it will be to implement.  When a model is overly theoretical, it is too hard to buy according to its recommendations and opportunity is missed.

Implementing an inaccurate model, built on incomplete or unreliable data, and having a poor alignment with actual buying practice can leave you worse off than having no model at all (future blog post!). 

Carefully test your model on all these questions, and you will find you are more likely to reach your objectives, instead of finding yourself teetering on the proverbial cliff.

Footnotes:

[1] BBC NEWS | UK | England | Bradford | Driver fined for sat nav blunder

[2] Science & Justice Journal, Vol 63, Issue 3, May 2023, Pages 421-426

The final destination: Incorporating ‘Death by GPS’ into forensic and legal sciences – ScienceDirect

Data, analytics and planning insights from….Andre Agassi??

Photo credit: Herald Sun

Andre Agassi is a former world #1 ranked tennis player and one of only 5 men to achieve the Career Grand Slam. As great a player as he was, he ran into someone even better in the person of Boris Becker, who broke on the scene with a wicked serve that many, including Agassi, struggled to deal with.

Agassi dropped his first three matches in a row to Becker.

So he tells us he went to the video data, studying Becker’s serve over and over again, trying to understand what made him so effective.

And then, there it was. Agassi found that “a-ha” piece of data we in analytics prize. He found that as Becker went into his serve motion, he would stick his tongue out. More importantly, the direction he stuck it out accurately predicted which direction he would serve….out wide or down the t/or to the body. Weird, but true.

Agassi had found a tell.

So good data and good analysis had provided Agassi with a reliable means to accurately predict what was coming.

He then goes on to tell us he had to consider how to use this data, and how he converted it into a plan. That, to me, was the breakthrough.

In his words:

“The hardest part wasn’t returning the serve. The hardest part was not letting him know that I knew this so I had to resist the temptation of reading his serve for the majority of the match and choose the moments when I was going to use that information…to break the match open.”

Brilliant.

Agassi went on to win 9 of the next 11 matches against Becker.

Agassi says “Tennis is about problem solving“.

And so is marketing.

In marketing and advertising we talk a lot about data and analytics but not as much as we should about how planners and strategists, both client and agency side, can use these resources.

As Agassi shows us, the data isn’t the plan and the analysis isn’t the plan. What makes a difference in effectiveness is the way a planner builds a story and then actions off solid analytics.

Far from constraining creativity, data and analytics, when used properly, should be a springboard for planning and creative idea generation.

Had Agassi simply applied the findings of his analysis as a hard and fast rule, Becker would have quickly figured out something was wrong and dug into his own data to find his own tell. And once he did, Agassi’s advantage would be gone.

Now, even though Navigation provides advanced analytics and we feel we can find those hidden advantages for clients, I think our best work has come in collaboration with gifted planners who can take things further than we can.

So the next time someone tells you data or analytics or AI is going to displace creativity, remember Andre Agassi and the extra spark a good strategist can bring to the table, and the better results that follow.

Agassi’s story, in his own words: