Optimization: It’s About Time

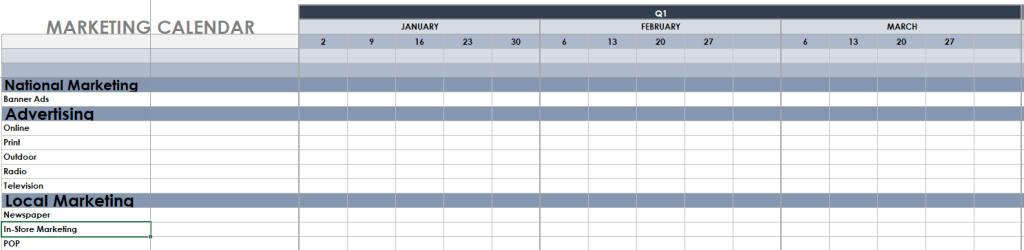
Marketing calendar for Q1 outlining national and local marketing strategies, including categories for advertising such as online, print, and radio.

Why Planners Must Understand Single-Period vs Multi-Period Optimization

A long-established principle in marketing science is that advertising works over time—not just in the moment it appears. An impression served today rarely produces all of its sales lift today. Instead, it generates a decay curve of effects that lasts for days, weeks, months, or even years depending on the channel, message, and category. These delayed effects interact with the lift created by subsequent ads, sometimes reinforcing them, sometimes diminishing them. What we observe as the “total effect of advertising” is really the accumulation of all these time-based interactions. This idea is supported by decades of research in advertising response modeling.

Models That Detect, Rather Than Assume, Time Effects

A well-designed model does not impose a time effect on the data. Instead, it identifies it empirically.
For example:

  • A brand TV campaign may show sales impact that persists for many months.
  • A short-term digital promotion may decay in days.

In our experience, these general patterns are surprisingly consistent across brands and categories, although the scale of the effects may vary. But the model must be allowed to discover them. That is why we test multiple lag structures for every channel/content combination until we reach a highly accurate model that also performs well in field validation.

Such a model forms the foundation for optimization algorithms used in planning.

But this is precisely where marketing leaders must exercise caution.


Where Planning Goes Wrong: The Hidden Assumption in Many Optimizers

Most advertising optimization tools optimize one period at a time.
A “period” might be a week, a month, or a quarter—but the optimizer assumes your goal is to maximize results inside that window only.

This is a critical limitation.

Why it matters

Imagine a marketer planning the next quarter. The underlying model correctly predicts that certain channels—say, brand TV—will continue generating lift well into the following quarter.

But a single-period optimizer ignores all lift that happens after the planning window.

As a result:

  • Channels with long-term effects appear undervalued.
  • Channels with short-term effects appear more attractive.
  • Budgets unintentionally shift toward digital, promotion-heavy, or lower-funnel tactics.

Nothing in the model is wrong—the issue is the optimizer’s time horizon.
Many planners do not realize this trade-off is happening under the hood.

This exact problem appears in the academic literature on dynamic advertising optimization, where single-period models are shown to bias allocations toward short-lived effects.


The Better Path: Multi-Period Optimization

A superior approach is a multi-period optimization algorithm—one that understands that advertising effects naturally spill over time.

Multi-period optimizers:

  • Value both in-period and future-period lift.
  • Produce allocations that reflect the true economics of advertising effects.
  • Better match how real brands actually grow value across fiscal cycles.

When using these tools, it is essential to examine both:

  1. In-period lift
  2. Total lift across all relevant periods

The difference between these two can be substantial—and strategically meaningful.


A Practical Example: The End of the Fiscal Year

This dynamic becomes most apparent in Q4 planning.

Most marketers work within an annual budget and face a familiar dilemma:

  • Maximize Q4 results (and hit internal targets)
  • Or
  • Invest in Q4 activity that also drives Q1 of next year

A single-period optimizer will aggressively favor Q4-only lift.
A multi-period optimizer presents a more realistic picture:

  • The true total return on each allocation
  • The degree to which Q4 decisions influence Q1
  • Where a marketer can “have their cake and eat it too” by hitting short-term targets and priming the next fiscal cycle

Accurate, lag-sensitive models empower better trade-off decisions.


Key Takeaways for Senior Decision-Makers

  • Advertising works over time. Optimizers must reflect this.
  • Many tools silently impose a single-period view of the world, skewing budget decisions.
  • Multi-period optimization more accurately represents how brands grow and how advertising creates value.
  • Reviewing both in-period and total lift supports better strategic judgment.
  • This becomes crucial in high-stakes situations such as year-end planning.

Is your brand underfunding advertising? You’re probably not alone.

A trio of roses in various stages of bloom, including one fully open flower and two partially wilted ones, set against a white background.

In over 20 years of helping brands measure and improve their advertising impact, we’ve found a striking pattern: nearly every brand we’ve worked with—bar one—was underinvesting in advertising. In every case, increasing spend would have driven incremental sales at a positive ROI (including time-discounted future cash flows).

And we’re not alone. Other seasoned practitioners report similar findings.

The only analytical approach that reliably reveals this underfunding—and prescribes how to fix it—is a properly built Marketing Mix Model (MMM). Not just any MMM, but one grounded in these five principles:

  • C-suite alignment – built to support executive-level goals
  • Accuracy – explains over 90% of historical sales variation and maintains predictive strength
  • Actionability – directly informs media buying across all channels
  • Holistic scope – incorporates paid, owned, and earned media, plus baseline drivers
  • Validated – tested and proven in forward-looking campaigns

At a time when brands face margin pressure and agencies are stretched thin, underfunding remains a silent killer of growth. It’s a shared problem for CMOs, CFOs, and CEOs—and a symptom of flawed budget-setting without robust analytics.

Want to unlock low-risk, high-return growth? Start by asking: Are we spending too little on advertising? Finding out pays big dividends, and if you need to upgrade your MMM to find out, that may be the best investment you can make.

A cautionary tale….

There’s a wave of social posts lately touting the ROI of one media channel over another. Perhaps you’ve seen them: “Channel X delivers an ROI of 5.60 vs. Channel Y at 3.50.” The implication is obvious — shift budget to Channel X, right?

Media owners are, of course, right to promote their offerings. But I wish they’d do so more carefully.  Maybe these posts should come with a footnote: * your results may vary.

The truth is, ROI is a function of many decisions — and highly sensitive to context. These values aren’t stable enough to support bold claims without major caveats. The fine print matters: such results are valid only within the scope of the study, and may not hold true in your business environment.

ROI for any channel can vary based on:

  • Spend level: In most channels, increasing spend decreases ROI (and vice versa), due to diminishing returns.
  • Mix effects: ROI is not a fixed channel property. Change the mix, and each channel’s ROI shifts.
  • In-channel tactics: Targeting, creative, timing — all affect outcomes. Some are captured in MMM models; some are not.

Even more importantly: ROI should not be your sole metric. A high-ROI channel that delivers little incremental volume may not help your business grow. Smart media planning balances financial with volume impacts.

ROI is best viewed not as a goal, but a constraint. The right question is: How do I maximize total incremental volume while staying within a viable ROI threshold? That answer usually lies in the mix — not a single channel.

And all of this assumes the underlying model is robust, validated, and comprehensive enough to rule out confounding effects.

So when you see bold ROI claims, take them with a generous pinch of salt. Don’t reallocate your budget based on someone else’s results. Instead, Find Out For Yourself (FOFY). Run simulations, explore marginal impacts, test different mixes. That’s how you make confident, context-specific decisions — and help ensure your results can vary in your favor.

MMM + CRM = ROI

Graphic showing the equation MMM + CRM = ROI. The left box has an upward trend graph labeled MMM, the middle box has a person icon labeled CRM, and the right box has a dollar sign and coins labeled ROI.

There is a class of marketer whose business model gives them a distinct advantage. The group includes banks, telcos, publishers, ecommerce sites, some companies in travel and health. Their difference? They know their customers directly; they can transact and communicate without going through intermediaries.  In recent years these businesses have been joined by new hybrid models, for example, retailers whose loyalty programs allows them to see individual customer behavior, not just sales baskets and aggregate unit volumes.

When it comes to building a marketing mix model for these brands, there are significant opportunities to improve returns on investment by combining an understanding of the impact of public facing media (eg TV, Print or OOH), as well as personal, (eg 1:1, CRM media such as email.

To achieve this, the data design needs to embrace all CRM media along with above-the-line media into the MMM (and all other forms of marketing communication!), so that you can understand the total business dynamic more coherently.  The model can then incorporate the effects of efforts aimed at cross-sell, up-sell, retention, and winback.

Whether you see this as an exciting opportunity probably depends on whether you’re a marketer who sees things as glass half full, or glass half empty.

The good news is this kind of integration offers the opportunity to increase the incremental effect of all efforts….CRM, brand building, etc…by double digit percentages.  On the CRM side, contact frequency, channel choice and customer prioritization all benefit from this broader view of what impacts buying.  

For the MMM view of marketing effect, we can meaningfully distinguish effect on current customers from effectiveness in converting prospects to customers.  We can also take advantage of segmentation data on the customer database to better understand how all forms of marketing communication affects customers from those segments.  For example, what marketing mix best supports the relationship with the minority of customers who generate the majority of profits?

The bad news is that by NOT doing this your budget is almost certainly wasting money on poor attribution, inappropriate allocation, and misleading evaluation of effect. And yet, many marketers make that same mistake.

Why does this happen?

  • Data and Decision Silos
    • In some companies CRM planning and decision-making are located in a different part of the company from media planning
    • There should be a point of integration of the two, but sometimes this is not the case or if there is, the processes function poorly
  • Attribution Bias
    • Thinking of attribution as analysis of only digital data or of MMM as only mass media blinds analysts and decision makers
  • Analytical Complexity
    • There is no doubt that this integration increases the complexity of both CRM and MMM modeling
    • In some organizations the perceived complexity is enough to turn marketing leadership away from the effort
  • Bad Incentive Design
    • Media teams may focus on MMM and only for media as their responsibility; same with CRM teams. 
    • Synergy between the two won’t happen unless they both support it, along with the CMO

How to overcome these barriers?

Consider what a double digit percentage improvement in incremental sales would mean to your company and your brand.  Compared to that, realigning incentives, improving analytical work and creating bridges between marketing teams is far less costly. 

So let’s say the glass is half full, and get to work on filling it to the brim.

Looking for help in making MMM + CRM = ROI work for you?  Contact me at dbeaton@navigationme.com

Advertising Leverage = CMO clout

Image credit: ChatGPT

The March 2025 SpencerStuart CMO Tenure Study (https://www.spencerstuart.com/research-and-insight/cmo-tenure-study-2025-the-evolution-of-marketing-leadership) has some encouraging words for CMOs: tenure is up slightly vs the last study and there is evidence of increased acceptance of the role in the C suite.  Key quote: “…more companies are shifting marketing to make it more overtly focused on delivering revenue.”

So for the aspiring or inspiring CMO, the idea of how to create and sustain advertising leverage: the incremental sales lift in a business created by advertising over a specific period of time, is as central as ever.

To illustrate, let’s consider an example drawn from our work with a major advertiser, measuring the incremental lift their advertising (covering all forms of marketing communication) delivers.  The numbers are disguised to support confidentiality, but the ratios shown here are seen broadly across many brands we have worked with.

Key NumbersDescriptionComments
$1.2 billionLast full year sales before taxes 
29.8%% of sales that are incremental; that is, driven by advertising.  More specifically, the % by which sales would fall if ad spend were stopped.For this brand, a number that has been stable for the 2-year period prior to this one.
$357.6 millionIncremental sales in $This is the value created by all agency and client teams working on this brand over this period, given the marcom budget, below.
$70 millionBudget for all forms of advertising and marketing communication for this one year period.Excludes professional fees paid to the agencies; see below.
$15 millionApproximate total of professional fees for all agencies active in this period.All forms of compensation: hourly rates, SOW rates, some media placement commission.
19%% increase in incremental sales possible if all marketing activity were improved through better allocation in spend by channel, markets, and over time. This number is derived by Back-Cast Optimization, a process of applying an optimization algorithm to maximize incremental sales by adjusting controllable activities.
$67.9 million$ increase in incremental sales if optimization were fully appliedAlso can be considered a measure of the effect of the current mix of activities.  The higher the upside identified in BCO, the less efficient current ad campaign designs are.

Given all this, where can the CEO/CFO/CMO best look for ways to improve business results?

One route, only too common, is to ask Procurement to squeeze fees across the board.  Operating on the $15 million of fees being paid, they might find 10-15% “savings”, resulting in a gain to the company on the order of $1.5-2.25 million.  Not unsubstantial.

But on the other hand, optimization of spend as shown here is capable of generating over 4x those gains.  Further, we need to recognize that Procurement efforts and Optimization efforts probably act against each other; cutting agency fees leads to disincentives and dysfunction that could undermine advertising’s effect.

What are the alternatives to cost-cutting? 

  • Invest more in advertising….use the ROI curve (https://navigationme.com/2024/12/02/win-your-budget-battles-at-the-frontier) to ensure this move builds profits
  • Invest more in creative; when done well this will amplify the effect of all other work
  • Evolve the product or lean into new product development
  • Revisit pricing strategies
  • Rethink the customer experience to look for more ways to build value for customers and the brand alike

….all of which require the ongoing talent and leadership of the CMO.

Consider for this brand, this roster of agencies and client marketing teams took a budget of $70 million in working media and created $357.6 million in incremental sales…a healthy leverage ratio.  Their value to the brand and the business is proven. And that should give this CMO the clout to be trusted to lead the brand to the next level.