Is the annual budgeting ritual holding your brand back?

The annual budget setting exercise is a rite of passage for every marketer once they become responsible for a budget, in most companies.

While they vary in practice, most have a common structure: Marketing works up a budget based on historic performance plus a wish list of projects they want to fund for the coming year.  For some companies, there are many marketing teams doing this workup. It will be up to the CMO to consolidate these and negotiate with the CFO and CEO for approval.

At the C suite level marketing’s plans and projections are important, but so are budget requirements from other teams across the enterprise.  Now the competition begins; who gets funded, who comes up short.

All of this is based on what is known at the time budget decisions are set.  For many companies, once the budget is set, it is set like hard concrete.  Woe be the manager who misses target or who is at risk to over-spend due to factors that could not have been known at the time the budget concrete was poured.  Media inflation, unexpected increases in costs, supply shocks in the value chain, they all have the potential to disrupt the best laid plans.

As the year unfolds, the concrete can create more problems:

  • If a new opportunity arises, and it inevitably does, marketing is forced to cut budgets where it does not want to in order to fund the new.  Why cut something that continues to look like it contributes to profitable growth?
  • Imagine that some of the things being tested in the previous year are returning much better results than status quo.  They should be rolled out, but can they be without cutting other productive projects?
  • Sometimes the market trends so favourably that a bright future is there for the taking….if marketing has the budget to exploit it.  If they don’t, the favourable tail winds may do more for competitors.
  • Predictive models, if sufficiently accurate and reliable, can show upside opportunities from those budgeted.  Are you able to take advantage?

Think of a fixed budget as a barrier to opportunity:

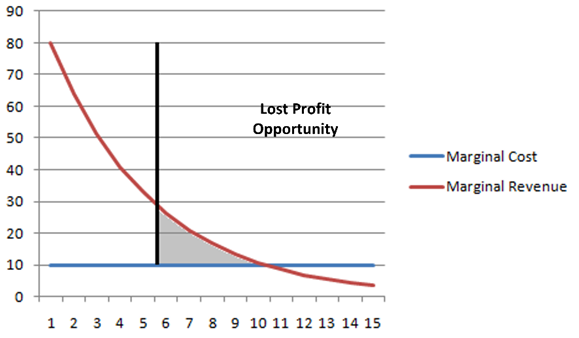
As budget rises, marginal revenue should as well, but on a diminishing curve.  For businesses with relatively fixed marginal costs, there will come a point where marginal costs exceed marginal revenue; this point represents the maximum contribution marketing can make to sales over this period.

But a fixed budget typically, in our experience, falls well short of this, leaving the brand/company with a lost profit opportunity, shown here as the grey area on the graph.

What can be done?

Consider building some agility into the budget process instead.  Instead of targets and budgets set in concrete for a year, there is the recognition that things change (for better or worse) and so should the budget.

Agile budgeting can incorporate contingency funding, flex targets, outcome-based opportunity funding, or rolling budgets over shorter time horizons.  Each has its strengths and weaknesses.  But before they are considered, you should decide if your annual budget process is holding you back, and by how much.  It might be time to lose that ball and chain.

Want to reduce churn?  Don’t model churn.

At least, don’t model churn as your only step.

A very common approach to churn reduction is to build predictive models, which are intended to produce a score for the likelihood a customer will churn within a given time period.  The approach is so common there are libraries of code available online for this purpose.  ChatGPT can provide Python code for the task.

But is it the right thing to do? 

We have been helping marketers reduce churn for over 20 years.  In our experience, predicting churn is a good first step, but you cannot stop there.

You actually want to predict not just churn risk, but the probability you can save the relationship, given your history of communication and offers used for this purpose. 

The highest churn risk scores may be pointing you to customers that are more than halfway out the door anyway.  Not only will your communications and offers not dissuade them…it’s too late…it might actually make things worse.  There is a “wake up” effect we have seen where at-risk customers realize their contract is up for renewal, for example, and it’s time to shop around, not jump at your first offer.

Think recovery, not just risk.

Next, think about the value of the relationship.  What is the predicted lifetime value in the coming years, after your planned intervention?  How long will they stay with you, what revenues would you predict over that period, and at what profit margins?  Knowing this number gives you the starting point for a key question: what are you prepared to spend to save this relationship? 

Extrapolate that question across all risk-save scores and you get a sense of the envelope of budget you need to reduce churn, as well as a sense of how much of a dent you can make in the churn rate.

Another way to think about churn reduction is as a problem in optimizing individual contacts….what offer, message, channel and timing.  This is where a product like our 1:1 Optimization system can help direct traffic and make both planning and execution easier.

Finally, you probably don’t have a churn problem (what??).  You probably have several.  Customers don’t all leave for the same reason, and a tactic designed to keep them for one irritant may be completely irrelevant, even counterproductive for another. 

Consider an example from wireless services.  What if a customer is irritated about billing problems, not resolved with your customer service team, repeatedly?  Consider another customer who is irritated about dropped calls.  What can you do to counter these two problems?  Would the same tactic work for both?  Would a tactic designed to work well for one be as effective for the other?

You should think about a modelling solution that provides risk scores, save scores, and what we call Action Codes.  Action codes combine an evaluation of why a customer is at risk with an action you choose to suppress that risk.  All three scores can be funnelled to the customer-facing systems you will use to deliver messages, whether that is an all purpose CRM system, a channel focused system such as for email, or other.

Put it all together and you have the answers you need to plan effective churn programs and translate strategies into individual action plans.

Best of luck and if we can help, don’t hesitate to contact us.

Win your Budget battles at the frontier

Every year the same ritual plays out in so many companies: Marketing submits its budget requests for the coming fiscal; Finance pokes holes in it; the CEO trusts Finance on these matters more than Marketing and assigns a budget and targets that Marketing must meet. Marketing feels hard pressed to meet those numbers; not enough budget and too much of a stretch target.

This negotiation could benefit from a little more science.  Predictive models of the kind that power more advanced versions of MMM are now capable of forecast accuracy that makes it possible to better understand the impact on the business of marketing activity (paid, owned, earned media and other drivers) and look out into the future covered by the marketing budget.  We can ask what sales (or other measures of success related to brand and business growth) we could expect at different budget levels.

Let’s look at an example of such a model being used to set a marketing budget.  We will start with the efficiency frontier:

We have built a model capable of predicting sales for the coming fiscal year.  We use that model to simulate what sales would be at different budget levels.  What we see is that sales rises as budget increases, but at a decreasing pace.  For each budget increase, sales rises by a lower percentage, giving us this flattening effect.

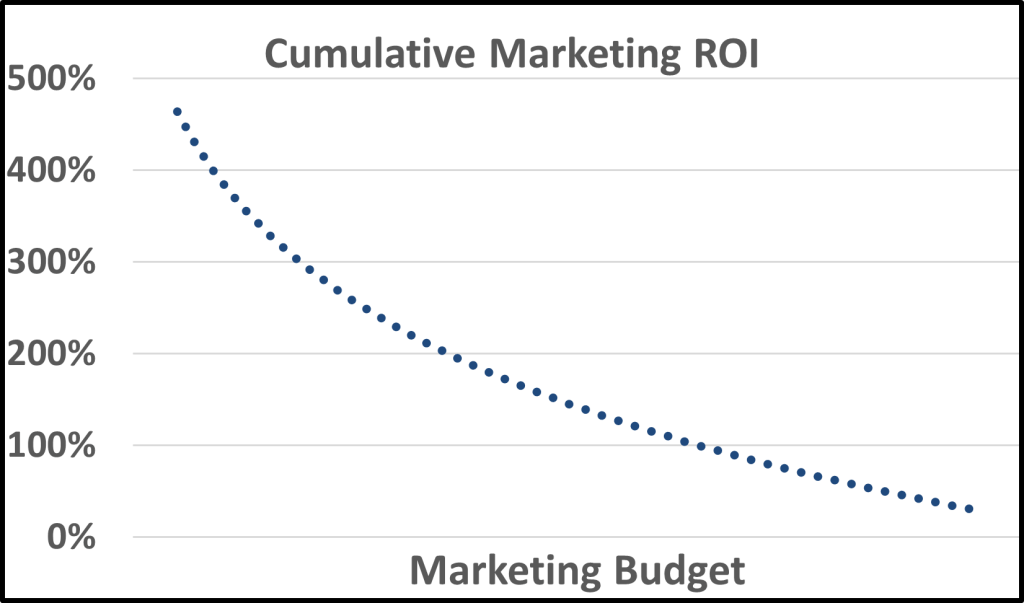
Now, let’s calculate the Marketing ROI for each budget scenario.  It would look like this:

The first thing to notice is that as we increase budget, Marketing ROI falls.  This is why we dont actually want to “maximize marketing ROI” as you may have heard some say.  The highest ROI in any reasonably managed system of marketing activity occurs at the lowest budget levels.  “Maximizing marketing ROI” is a good way to shrink a business.

Marketing ROI is not a goal; it is a constraint.  We want the benefits of marketing actions to exceed their costs; to make a positive contribution to business profits.  As we add budget, we would inevitably spend it on less and less productive actions, which gives us a diminishing return curve.

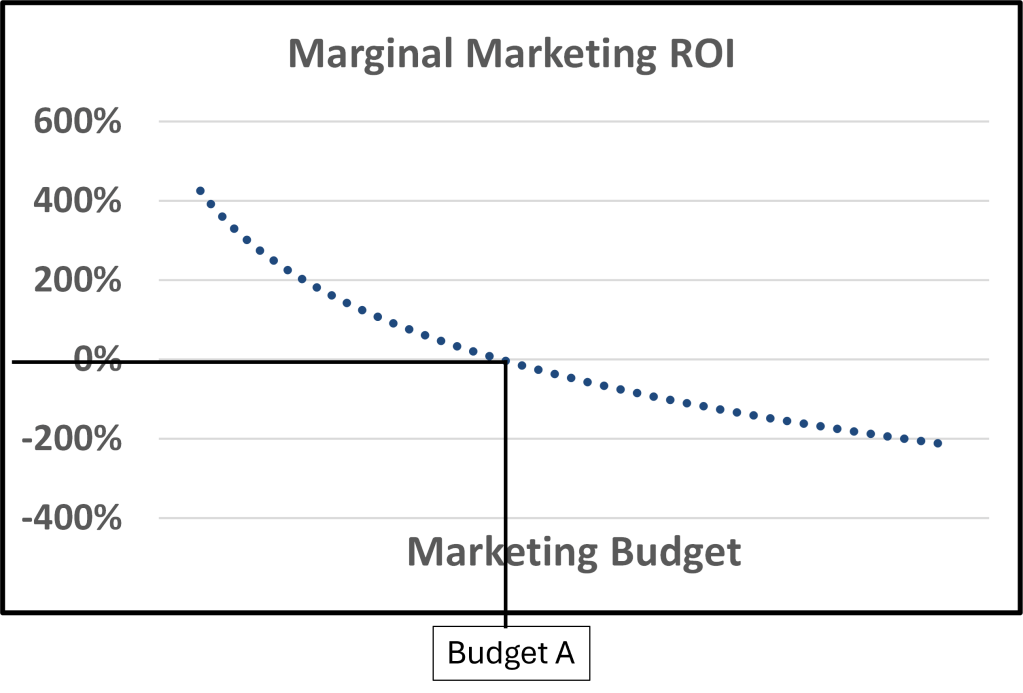
So how do we use this approach to set marketing budgets?  Let’s now consider marginal marketing ROI.…the ROI of the increase in spend from one scenario to the next highest spend, in relationship to the sales over that span.  That curve for this data looks like:

Notice that at one point, adding budget returns a negative ROI.

At Budget A, marketing ROI is at break even for the spend between that scenario and the next lowest.  If we increased budget further, we would lose money on those additional activities…something we want to avoid.

At Budget A, marketing’s contribution is at its maximum for this forecast period, and for the market dynamics currently in play, according to the model. 

Let’s put all three graphs together to see the dynamic more clearly:

Key points:

  • Higher marketing ROI’s are found at lower sales levels than Budget A.  Chasing higher marketing ROIs results in lower sales; not good for the brand or the business.
  • Increasing budget above Budget A results in losses on those additional budgets, even though overall, marketing ROI is still positive (until some point where the losses on these additional sales offsets all the gains on sales up to that point.  At an extreme, additional budget may result in no sales increase at all.). A brand could still decide they want to spend above Budget A, to buy share, for example.  With this type of analysis they would know how much that increased sales number is really costing them.

Based on our experience, most marketers spend well below the level of Budget A….missing a lot of opportunity to grow the brand and the business.

Taking this approach requires that the modelling be of sufficient accuracy and reliability.

That is, the model is…..

  • Built around C suite goals, not marketing vanity metrics…
  • …taking a holistic approach to the data used, covering all of the major drivers of business outcomes…
  • …at a level of accuracy that reduces the chances of bad decision making (see Will that model get you promoted? Or fired? (Part 1))…
  • ….has been tested and validated to the satisfaction of the C suite.

Budget battles could be a lot less rancorous and lead to a much larger contribution to brand and business goals if both Marketing and Finance could agree on how the frontier is to be measured and how to use this knowledge to maximize marketing’s contribution to growth.

CMOs: The marketing metric you MUST socialize to the C Suite (hint; it’s not NPS)

It’s incremental lift: the sales your company generates every year due to all forms of marketing communications.

Or put another way, the sales your company would lose if you stopped marcom.   

Based on Navigation’s experience in measuring this, for some companies, that number could be over 50% of sales.

Think about the importance to your company of marketing in that context. 

But to be credible, your source must be a model that meets or exceeds best practices; it must be:

  • Developed around measures the C suite finds meaningful such as sales, and NOT around vanity metrics that have no clear relationship to business success.  The C suite must see clearly how this model supports their goals.
  • Includes data on all, or at least the most important, factors that shape business outcomes.  Certainly paid media, but owned and earned as well.  And factors that may shape outcomes even if not under a CMO’s control such as weather or economic changes.
  • Is accurate; a proven ability to explain over 90% of variation in outcome measures over the most recent 3 year period.
  • Is actionable; you can then demonstrate what to do to improve outcomes, or what would happen if a bad decision were taken
  • Tested in market and shown to produce recommendations that lead to demonstrably better results.

Imagine your relationship with the C suite with this knowledge in place:

  • Imagine a C suite that respects the practice of marketing instead of disparaging it or treating it as an expense taken reluctantly.
  • Imagine a C suite that is looking to help expand the impact of marketing, instead of reflexively cutting marketing budgets in hard times.
  • Imagine the effect such knowledge has on your own team, and the pride taken by knowing how important their work is to the health of their company.
  • Imagine the confidence that comes with making a clear contribution and being appreciated for it.
  • Imagine how much easier budget approvals would be with the full team aligned behind this metric. 
  • Imagine being a valued C suite team member and a driver of growth. 
  • Imagine measuring incremental sales properly, socializing that finding to the C suite, and then updating it regularly.

Is that model going to get you promoted?  Or fired? (Part 2)

The marketing director approached me after I had presented our work in multi-channel ad effect measurement at a large telco.  I had not met him before and he worked for another business unit to the one that had hired us.

He was almost embarrassed to ask the questions that were clearly bothering him.  We sat down over coffee and he told me his story.

He was responsible for direct and digital marketing to the telco’s existing customers, selling a service to add to the one(s) they already had.  His channels were email and addressed direct mail.  Since his budget was limited, he asked the in-house modelling group to help him target his campaign, asking who should get both an email and a DM?  What he showed me was a report of new service activation rates by model decile, after the last campaign had finished.

Before we consider what he and I were looking at, let’s start with what a good targeting model should deliver in a case like this.  Such a model should use data about customers: description and their history of purchases, cancellations, billing and customer service interactions.  It should use the communication history for each individual customer; what channel was used to contact him/her, when, for what product, what offer and what messaging and any interactions that had resulted from campaigns used in the past.  In the case shown below, this particular model also uses neighbourhood demographics.

Consider the following post-campaign report, from a telco client of ours, also for a customer cross-sell campaign.  Predicted scores are the probability of activation (the customer orders and installs the product) for the campaign period (here, 4 weeks after first contact).  These scores were generated about 12 weeks before the campaign was launched; enough time to prepare the mailers.  Actual scores are recorded for the 4 week campaign window, against both non-communicated and non-targeted control groups (our take on control group design for CRM will be covered in a future blog post). 

There are three features of this report we should pay attention to: (deciles represent scores for each customer, averaged)

  1. Each decile shows predicted scores that are lower than the decile before; think of this as a “ski slope” shape. 
  2. There is excellent differentiation between predicted scores for the best decile vs the average (here, 3.1 times) or vs the lowest decile (here, 15.3 times).  The more differentiation, the more opportunity we have to create business value.
  3. There is a close correspondence between predicted and actual by decile. The model does not over- or under-predict for any given decile.  This level of accuracy allows us to invest with confidence.

To the predictions we can now add the cost of contact (here, DM + EM = $3.00) and value of activation (here, $75.00), which gives this picture, for a base of 5 million customers (outcomes assume we contact all customers in each decile):

For planning purposes, we would select only the top 7 deciles in order to maximize profit. 

(For a future blog post: how we can use this as a starting point to create even more value)

Now, let’s consider the picture our director of marketing was looking at.  I mocked up the report, here, from memory. 

As you can see, the best decile for activation rate is NOT the first…it is the fourth.  The first, which should be the best, is the 6th worst.  The 7th has good performance…who would have thought?  In short, instead of seeing the “ski slope” shape we see with a good model, this report looks like a hockey player’s teeth after the playoffs. 

You cannot make good targeting decisions using this model. Why was it performing this way?

I went next to see a senior member of the modelling team and we quickly agreed on the cause: the model had no communication variables at all.  Instead of being able to ask the question, “what would be the predicted activation rate if I contacted a given customer, with a given channel”?, the model the marketing director was given provided scores that had no relationship to the outcomes he wanted.

Why was it designed this way?  Because the modelling group felt that their scores reflected a prioritization of customers for whom a sale of this type would be most likely to improve retention and generate long term cash flows.  While this is useful as a way to study customer behaviour, it is useless when it comes to designing a marcom campaign, which was their brief. The modelling group felt that the director of marketing had to “learn” how to sell to the top deciles. How?  That question went unanswered.

I often say in the analytics business there is a substantial knowledge gap between the people building models and the decision-makers using them. This gap should be closed with clear, transparent communication. In this case, that didn’t happen; the modelling group pushed a solution that fit their preferences, even knowing it was not what was asked for. 

In cases like these, such models are more likely to get their marcom users fired than promoted.  And that is a failure for all involved.

DB